

")
")


The Centers for Disease Control (CDC) reports the number of states with lots of fat people has nearly doubled since 2018.
Four more states have been added to CDC’s obesity list since the Covid shutdowns.
Scientists say extreme obesity is a major risk factor for Covid-19.
According to CDC’s stats, Asian-Americans are generally not fat. No state had an obesity prevalence at or above 25% among Asians.
The fattest, measured by race, which is how CDC categorizes the statistics, are Blacks. CDC says that 35 states and the District of Columbia have an obesity prevalence at or above 35% among Blacks.
Next in line on the fat train are Hispanic residents. CDC says 22 states have an obesity prevalence at or above 35% among Hispanics.
And 7 states had an obesity prevalence at or above 35% among White residents.
The sixteen states that have the highest adult obesity prevalence are:
- Alabama
- Arkansas
- Delaware (new this year)
- Indiana
- Iowa (new this year)
- Kansas
- Kentucky
- Louisiana
- Michigan
- Mississippi
- Ohio (new this year)
- Oklahoma
- South Carolina
- Tennessee
- Texas (new this year)
- West Virginia
Not that it matters, but all of the states on the list except Delaware and Michigan went in the Trump column in the 2020 presidential election.
Read more from CDC below.
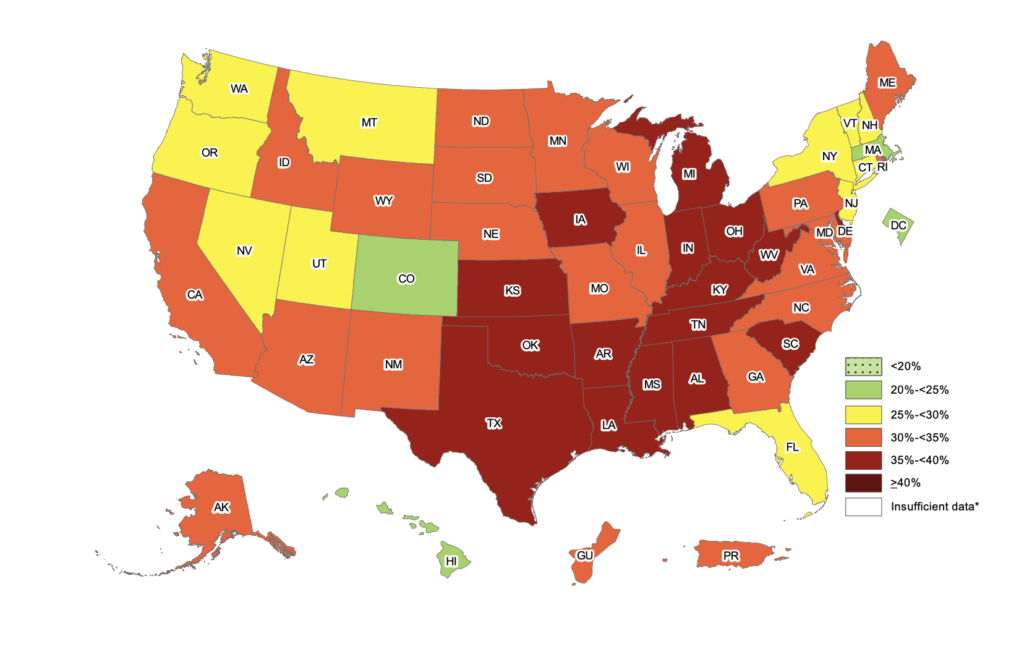
Number of States with High Obesity Prevalence Rises to Sixteen
The number of states in which at least 35% of residents are obese has nearly doubled since 2018 – and disparities persist – according to new data from the Centers for Disease Control and Prevention.
Up from nine states in 2018 and 12 in 2019, the 2020 Adult Obesity Prevalence Maps show that 16 states now have an adult obesity prevalence at or above 35%: Alabama, Arkansas, Delaware (new this year), Indiana, Iowa (new this year), Kansas, Kentucky, Louisiana, Michigan, Mississippi, Ohio (new this year), Oklahoma, South Carolina, Tennessee, Texas (new this year), and West Virginia.
Disparities in obesity persist
Adult obesity prevalence by race, ethnicity, and location is based on self-reported height and weight data from theBehavioral Risk Factor Surveillance System. Combined data from 2018-2020 show notable racial and ethnic disparities. Among states and territories with sufficient data*:
- 0 states had an obesity prevalence at or above 35% among non-Hispanic Asian residents. However, some studies have indicated that the health risks associated with obesity may occur at a lower body mass index (BMI) for some people of Asian descent.
- 7 states had an obesity prevalence at or above 35% among non-Hispanic White residents.
- 22 states had an obesity prevalence at or above 35% among Hispanic residents.
- 35 states and the District of Columbia had an obesity prevalence at or above 35% among non-Hispanic Black residents.
Adults with obesity are at increased risk for many other serious health conditions such as heart disease, stroke, type 2 diabetes, some cancers, and poorer mental health. Individuals should talk regularly with their healthcare provider about their body mass index, family history of chronic disease, current lifestyle, and health risks.
What it will take
To change the current course of obesity will take a sustained, comprehensive effort from all parts of society. We will need to acknowledge existing health disparities and health inequities and address the social determinants of health such as poverty and lack of health care access if we are to ensure health equity. These maps help by showing where we need to focus efforts to prevent obesity and to support individuals with this disease.
Community-level data on adult obesity prevalence is available at the CDC’s PLACES website.
*The number of states and territories with sufficient data varies based on the map. 35 states, the District of Columbia, and Guam had sufficient data among non-Hispanic Asian adult. 49 states, the District of Columbia, Guam, and Puerto Rico had sufficient data among non-Hispanic White adults. 49 states, the District of Columbia, Guam, and Puerto Rico had sufficient data among Hispanic adults. 48 states, the District of Columbia, and Guam had sufficient data among non-Hispanic Black adults
